
The Mystic H1B Decoded
Deep dive into H1B Visa Analysis.
What is H1B Visa?
-
The H-1B is a visa in the United States under the Immigration and Nationality Act, section 101(a)(15)(H) that allows U.S. employers to employ foreign workers in specialty occupations.
-
A specialty occupation requires the application of specialized knowledge and a bachelor’s degree or the equivalent of work experience.
-
The duration of stay is three years, extendable to six years, after which the visa holder may need to reapply.
-
Laws limit the number of H-1B visas that are issued each year: 206,002 new and initial H-1B visas were issued in 2022.
-
Employers must generally withhold Social Security and Medicare taxes from the wages paid to employees in H-1B status.
Quick facts about H1B Visa lottery:
- The Immigration Act of 1990 established a limit of 65,000 foreign nationals who may be issued a visa each fiscal year.
- An additional 20,000 H-1Bs are available to foreign nationals holding a master’s or higher degree from U.S. universities.
- In addition, excluded from the ceiling are all H-1B non-immigrants who work at universities, non-profit research facilities associated with universities, and government research facilities.
- Person in H-1B status must continue to be employed by their employer in order to stay in H-1B status. If the person’s employment ends for any reason, the person must leave the United States, unless the person is granted a change of status or finds another employer compatible with the H-1B status.
- The United States Citizenship and Immigration Services allows grace period of up to 60 days to stay in the United States after the person’s end of employment.
Data Source
- This dataset contains five year’s worth of H-1B petition data, with approximately 3 million records overall.
- The columns in the dataset include case status, employer name, worksite coordinates, job title, prevailing wage, occupation code, and year filed.
Purpose of the Analysis
- How the number of visa applications are growing over the years.
- Companies offering H1B sponsorships.
- Key roles that are being offered Sponsorships.
- Salary distribution for the roles being offered.
- How the Data related roles look like.
- Acceptance and Rejection rate.
- Which part of the United States records more applications.
Importing Necessary Libraries
#Importing necessary libraries
import pandas as pd
import numpy as np
import matplotlib.pyplot as plt
import seaborn as sns
from os import path
from IPython import display
Reading CSV
df = pd.read_csv("../input/h-1b-visa/h1b_kaggle.csv")
Trim function
def trim(x):
    if x == 'TATA CONSULTANCY SERVICES LIMITED':
        return 'TCS'
    elif x == 'DELOITTE CONSULTING LLP':
        return 'DELOITTE'
    elif x == 'IBM INDIA PRIVATE LIMITED':
        return 'IBM LIMITED'
    elif x == 'COGNIZANT TECHNOLOGY SOLUTIONS U.S. CORPORATION':
        return 'COGNIZANT SOLUTIONS'
    else:
        return x
df['EMPLOYER_NAME'] = df['EMPLOYER_NAME'].apply(trim)
Visa applications over years
yoy_applications = df.groupby("YEAR").count()['CASE_STATUS'].values
year = [ i for i in range(2011,2017)]
plt.figure(figsize=(15,8))
sns.set_style('whitegrid')
sns.lineplot(x = year,y = yoy_applications,color='green')
plt.title("No of applications over years")
plt.plot();
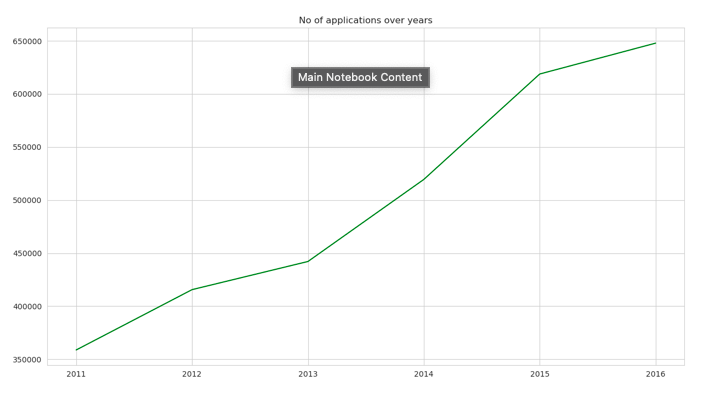
Findings:
- No of applications have almost tripled from 2011 to 2016.
- There has been a steady or almost exponential increase in the number of applications over the years, While the number of slots available per year stayed constant at 65000 slots.
- To put it in a probabilistic manner, as the number of applications increasing exponentially your probability of being picked up is reducing dramatically.
Chances of Picking
chance_of_picking = (65000/np.array(yoy_applications ))*100
plt.figure(figsize=(18,8))
sns.lineplot(x = year,y = chance_of_picking,color='red')
plt.title("Chance of Picking")
plt.ylabel("Picking Chance%")
plt.plot();
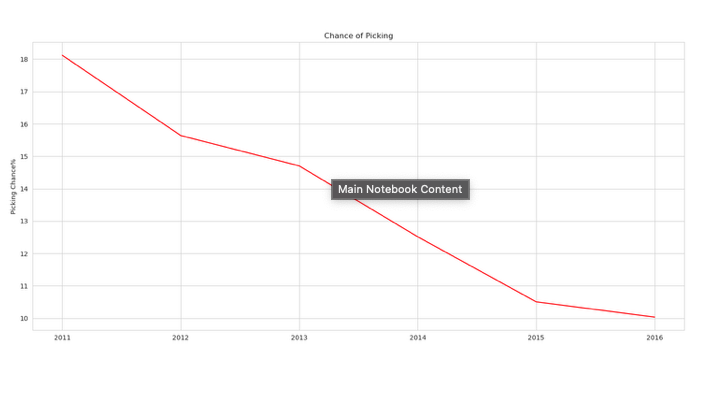
Findings:
- If you have applied for a H1B Visa in 2011, Your chances of being picked is at approximately 18%.
- Whereas 5 years down the line, your probability has dropped down to 10%.
- However there can be external factors involved in deciding your chances(Such as applying more than one H1B applications per applicant) which increases your probability.
- But to put it in the clean perspective as the number of applications are growing, your chance at the table is goind down.
Case status per year
col = ['green','red']
df1 = df[df['CASE_STATUS'].isin(['CERTIFIED','DENIED'])]
df2 = df1.groupby(['YEAR','CASE_STATUS'])['SOC_NAME'].count().reset_index()
plt.figure(figsize=(16,8))
sns.barplot(x = df2['YEAR'],y = df2['SOC_NAME'],hue=df2['CASE_STATUS'],palette=col)
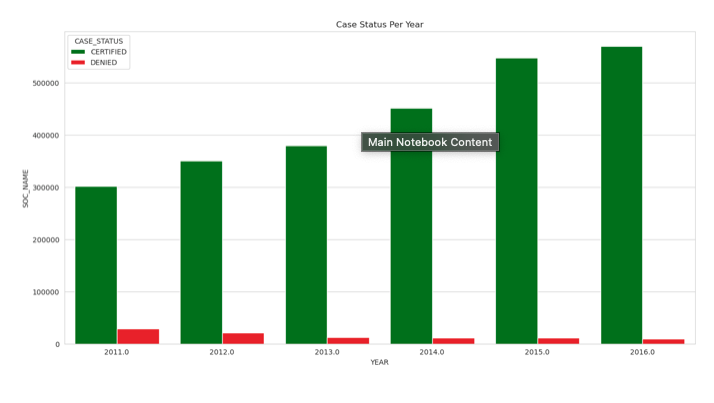
plt.title("Case Status Per Year");
No of Full time & Part time roles offered from 2011 to 2016.
col = ['red','green']
count_position = df.groupby(["YEAR","FULL_TIME_POSITION"]).count()['CASE_STATUS'].reset_index()
plt.figure(figsize=(16,8))
sns.barplot(x = count_position['YEAR'],y = count_position['CASE_STATUS'].values,hue=count_position["FULL_TIME_POSITION"],palette=col)
plt.title("No of Full_time Vs Part-time roles offered")
plt.plot();
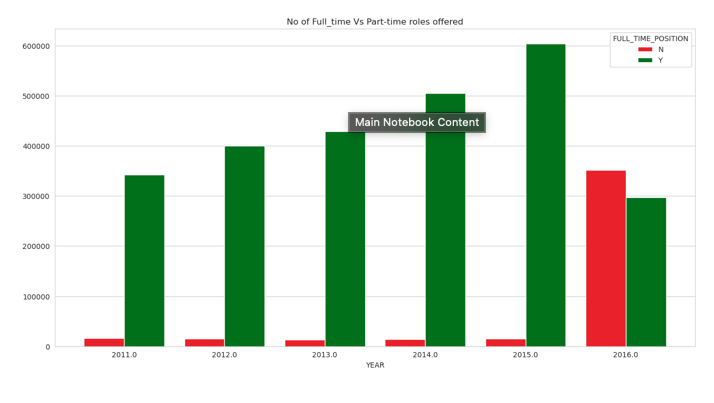
Findings:
- Surprisingly More number of part time roles were applied for H1B sponsorship during 2016.
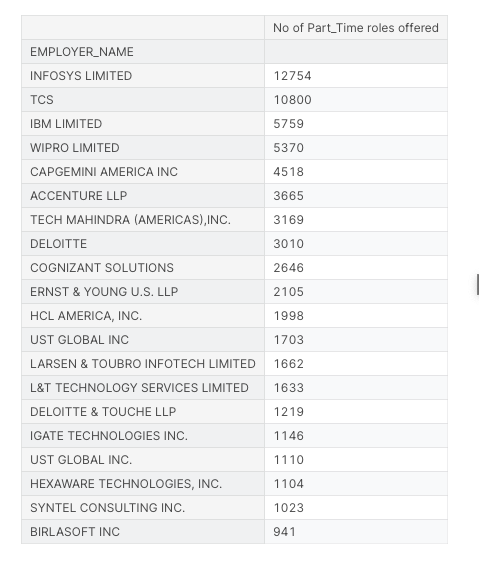
Which Companies offered Part time roles during 2016?
df1 =df[ df['YEAR']==2016]
df1 = df1[df1['FULL_TIME_POSITION']== 'N']
part_time = df1.groupby('EMPLOYER_NAME').count().sort_values(by='YEAR',ascending=False)
part_time = part_time[['YEAR']]
part_time.columns = ['No of Part_Time roles offered']
part_time[:20]
Major H1B Offering Companies
col = ['brown','brown','brown']
col.extend(['grey' for i in range(7)])
companies = df.groupby("EMPLOYER_NAME").count().sort_values(by = "CASE_STATUS",ascending=False)[:10]
no_of_applications = companies['CASE_STATUS'].values
plt.figure(figsize=(15,10))
sns.barplot(x = no_of_applications,y = companies.index,orient='h',palette=col)
plt.title("Top 10 Companies with highest number of H1B Applications")
plt.xlabel("No of Applications")
plt.ylabel("")
plt.plot();
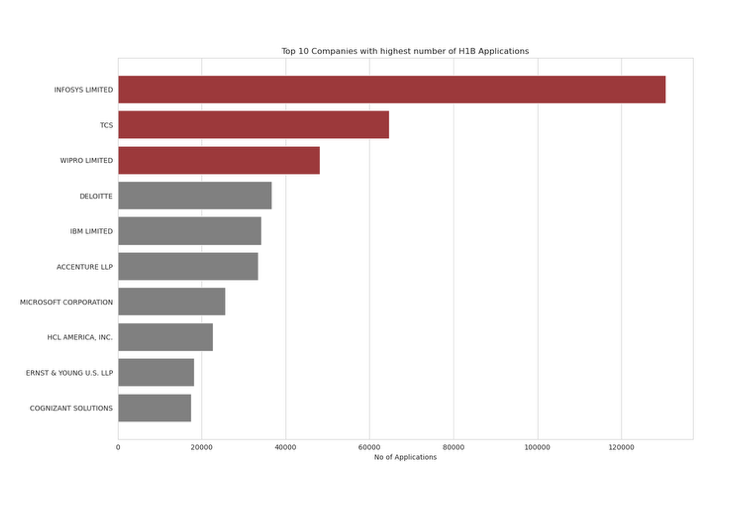
Findings:
- No Surprise that the top 3 companies offering H1B sponsorship are INFOSYS, TCS & WIPRO.
- Some of the major consulting companies in India are the major applicants in H1B lottery.
- Key reason behind are cheap labor, plethora of resources.
No of applications made by Top 5 Companies over Years
color = ['red','grey','grey','grey','grey','grey']
df1 = df[df['EMPLOYER_NAME'].isin(['INFOSYS LIMITED','TCS','WIPRO LIMITED','DELOITTE','IBM LIMITED'])]
df2 = df1.groupby(['YEAR','EMPLOYER_NAME'])['SOC_NAME'].count().reset_index()
plt.figure(figsize=(14,8))
sns.barplot(x = df2['YEAR'],y = df2['SOC_NAME'],hue=df2['EMPLOYER_NAME'],hue_order=['INFOSYS LIMITED','TCS','WIPRO LIMITED','DELOITTE','IBM LIMITED'],palette=color)
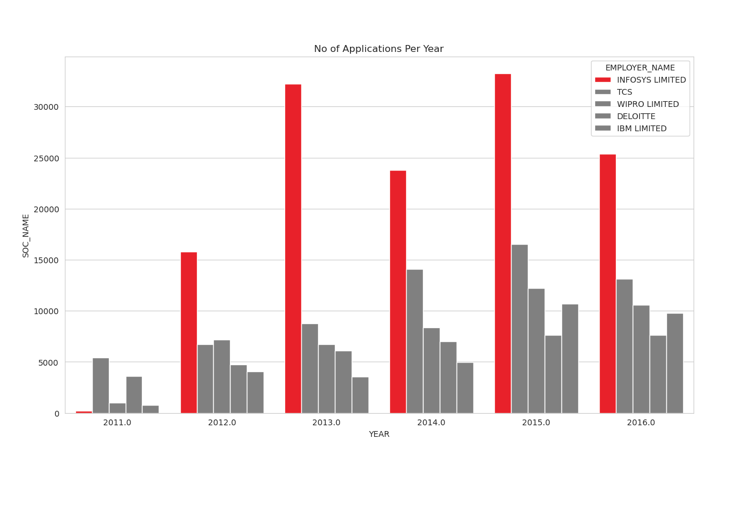
plt.title("No of Applications Per Year");
 Findings:
- During 2011, Infosys has the lowest number of H1B applications.
- Fast forward to 2016, Infosys has become the biggest company in terms of applications.
What type of roles are being sponsored by the top companies?
Infosys = df[df['EMPLOYER_NAME'] == "INFOSYS LIMITED"]
Infosys_Roles = Infosys.groupby("JOB_TITLE").count().sort_values(by="CASE_STATUS",ascending=False)
Infosys_Roles = Infosys_Roles[['CASE_STATUS']][:10]
#Infosys_Roles = Infosys_Roles.style.set_caption('INFOSYS')

TCS = df[df['EMPLOYER_NAME'] == "TCS"]
TCS_Roles = TCS.groupby("JOB_TITLE").count().sort_values(by="CASE_STATUS",ascending=False)
TCS_Roles = TCS_Roles[['CASE_STATUS']][:10]
fig = plt.figure(figsize = (10, 12))
ax = fig.add_subplot(411)

ax.table(cellText = Infosys_Roles.values,
          rowLabels = Infosys_Roles.index,
          colLabels = ['No of Applications from 2011 to 2016'],
          loc = "center"
         )
ax.set_title("Infosys")

ax.axis("off");

ax1 = fig.add_subplot(412)
ax1.table(cellText = TCS_Roles.values,
          rowLabels = TCS_Roles.index,
          colLabels = ['No of Applications from 2011 to 2016'],
          loc = "center"
         )
ax1.set_title("TCS")

ax1.axis("off");


#Wipro
Wipro = df[df['EMPLOYER_NAME'] == "WIPRO LIMITED"]
Wipro_Roles = Wipro.groupby("JOB_TITLE").count().sort_values(by="CASE_STATUS",ascending=False)
Wipro_Roles = Wipro_Roles[['CASE_STATUS']][:10]

#Deloitte
Deloitte = df[df['EMPLOYER_NAME'] == "DELOITTE"]
Deloitte_Roles = Deloitte.groupby("JOB_TITLE").count().sort_values(by="CASE_STATUS",ascending=False)
Deloitte_Roles = Deloitte_Roles[['CASE_STATUS']][:10]

ax = fig.add_subplot(413)

ax.table(cellText = Wipro_Roles.values,
          rowLabels = Wipro_Roles.index,
          colLabels = ['No of Applications from 2011 to 2016'],
          loc = "center"
         )
ax.set_title("WIPRO")

ax.axis("off");

ax1 = fig.add_subplot(414)
ax1.table(cellText = Deloitte_Roles.values,
          rowLabels = Deloitte_Roles.index,
          colLabels =['No of Applications from 2011 to 2016'],
          loc = "center"
         )
ax1.set_title("TCS")

ax1.axis("off");
Findings:
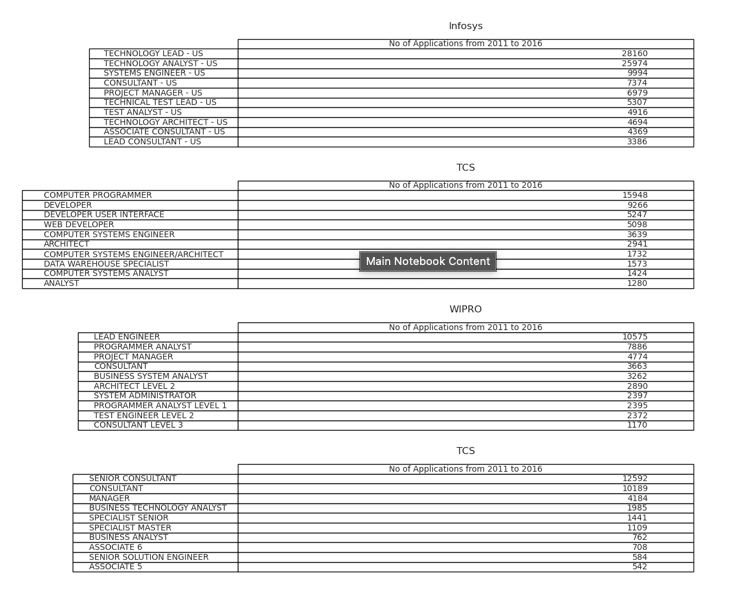
- If you are employed in any of the roles in the respective companies, Then you have good chances of being offered H1B sponsorship to undertake job in United States.
- Infosys is offering H1B majorly to lead consultants, Whereas TCS is offering much of the H1B’s to the developers.
- Most of the companies are offering H1B to majority of the key software roles.
Roles with highest no of applications from 2011 to 2016
Roles = df.groupby("JOB_TITLE").count().sort_values(by="CASE_STATUS",ascending=False)
plt.figure(figsize=(15,10))
sns.set_style('whitegrid')
sns.set_palette('colorblind')
sns.barplot(x = Roles[:10]['CASE_STATUS'],y = Roles.index[:10],orient='h',palette='viridis')
plt.title("Top 10 Roles")
plt.plot();
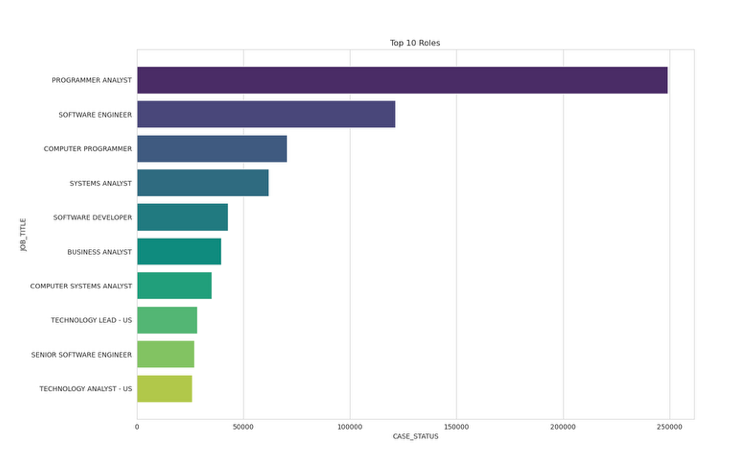 Findings:
- Programmar Analyst has the highest number of H1B applications followed by Software Engineer and Computer Programmer.
Salary distribution for Top roles
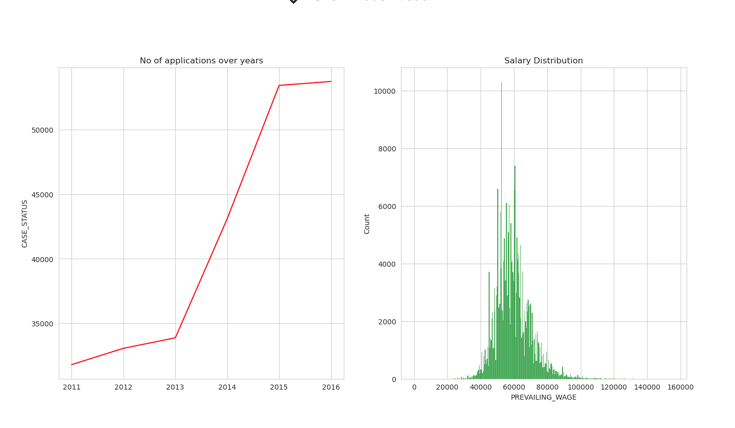
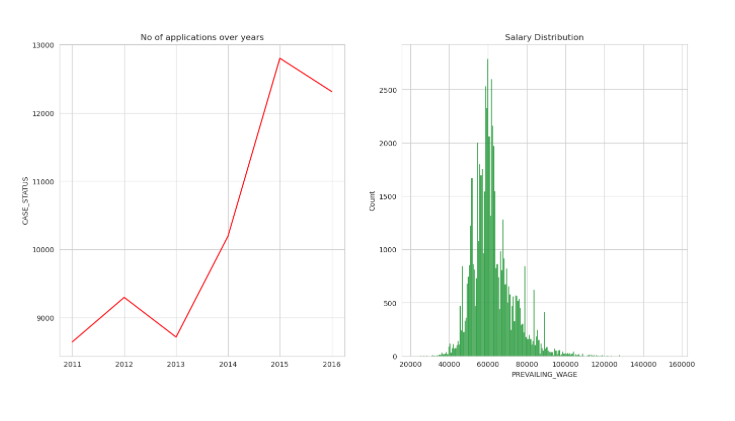
PROGRAMMER ANALYST
plt.figure(figsize=(16,8))
plt.subplot(1,2,1)
sns.set_style('whitegrid')
P_A = df[df['JOB_TITLE'] == "PROGRAMMER ANALYST"].groupby('YEAR').count()['CASE_STATUS']
year = [ i for i in range(2011,2017)]
sns.lineplot(x = year,y = P_A,color='red')
plt.title("No of applications over years")
plt.plot();

plt.subplot(1,2,2)
plt.title("Salary Distribution")
PM = df[(df['JOB_TITLE'] == "PROGRAMMER ANALYST") & (df['PREVAILING_WAGE']<300000)]
sns.histplot(x = PM['PREVAILING_WAGE'],color='green');
plt.plot();
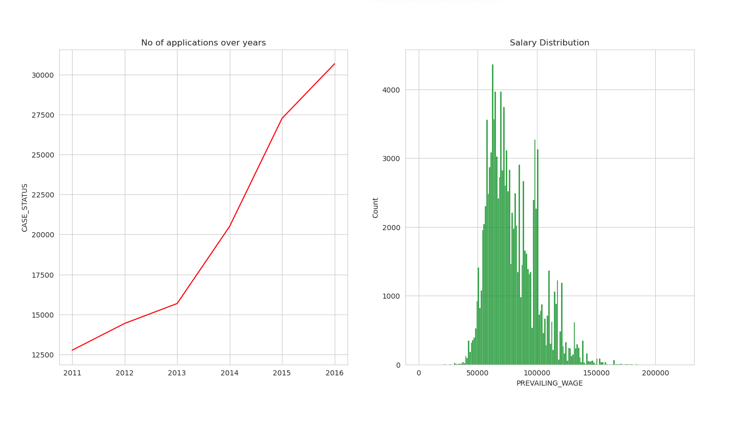
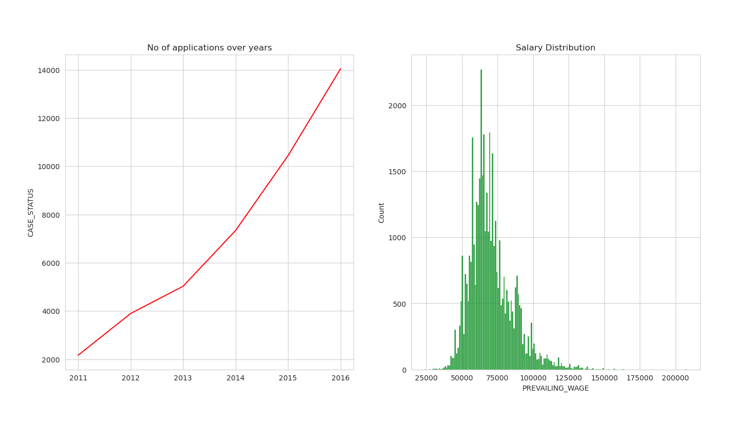
SOFTWARE ENGINEER
plt.figure(figsize=(16,8))
plt.subplot(1,2,1)
SOFTWARE_ENGINEER = df[df['JOB_TITLE'] == "SOFTWARE ENGINEER"].groupby('YEAR').count()['CASE_STATUS']
year = [ i for i in range(2011,2017)]
sns.lineplot(x = year,y = SOFTWARE_ENGINEER,color='red')
plt.title("No of applications over years")
plt.plot();

plt.subplot(1,2,2)
plt.title("Salary Distribution")
PM = df[(df['JOB_TITLE'] == "SOFTWARE ENGINEER") & (df['PREVAILING_WAGE']<300000)]
sns.histplot(PM['PREVAILING_WAGE'],color='green');
plt.plot();
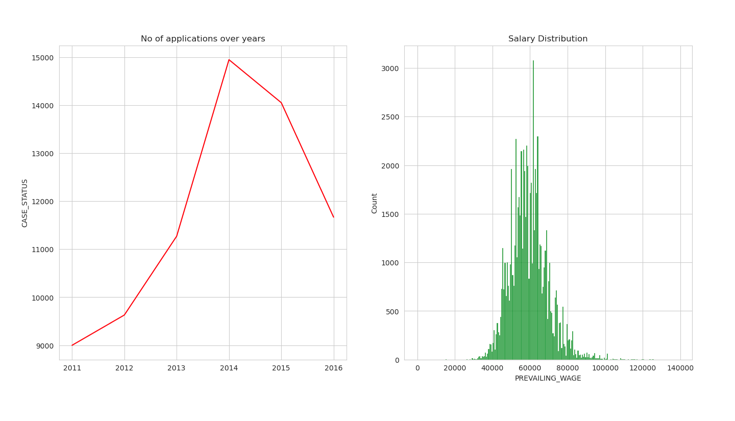
COMPUTER PROGRAMMER
plt.figure(figsize=(16,8))
plt.subplot(1,2,1)
P_A = df[df['JOB_TITLE'] == "COMPUTER PROGRAMMER"].groupby('YEAR').count()['CASE_STATUS']
year = [ i for i in range(2011,2017)]
sns.lineplot(x = year,y = P_A,color='red')
plt.title("No of applications over years")
plt.plot();

plt.subplot(1,2,2)
plt.title("Salary Distribution")
PM = df[(df['JOB_TITLE'] == "COMPUTER PROGRAMMER") & (df['PREVAILING_WAGE']<300000)]
sns.histplot(PM['PREVAILING_WAGE'],color='green');
plt.plot();
SYSTEMS ANALYST
plt.figure(figsize=(16,8))
plt.subplot(1,2,1)
P_A = df[df['JOB_TITLE'] == "SYSTEMS ANALYST"].groupby('YEAR').count()['CASE_STATUS']
year = [ i for i in range(2011,2017)]
sns.lineplot(x = year,y = P_A,color='red')
plt.title("No of applications over years")
plt.plot();

plt.subplot(1,2,2)
plt.title("Salary Distribution")
PM = df[(df['JOB_TITLE'] == "SYSTEMS ANALYST") & (df['PREVAILING_WAGE']<300000)]
sns.histplot(PM['PREVAILING_WAGE'],color='green');
plt.plot();
SOFTWARE DEVELOPER
plt.figure(figsize=(16,8))
plt.subplot(1,2,1)
P_A = df[df['JOB_TITLE'] == "SOFTWARE DEVELOPER"].groupby('YEAR').count()['CASE_STATUS']
year = [ i for i in range(2011,2017)]
sns.lineplot(x = year,y = P_A,color='red')
plt.title("No of applications over years")
plt.plot();

plt.subplot(1,2,2)
plt.title("Salary Distribution")
PM = df[(df['JOB_TITLE'] == "SOFTWARE DEVELOPER") & (df['PREVAILING_WAGE']<300000)]
sns.histplot(PM['PREVAILING_WAGE'],color='green');
plt.plot();
How the Data related roles look like
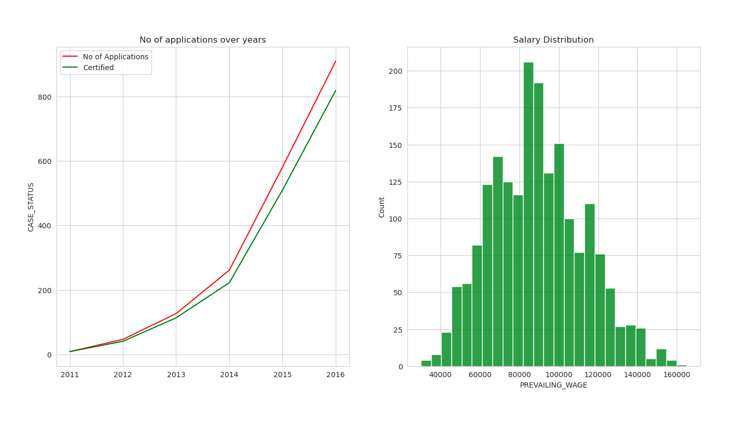
Data Scientist
plt.figure(figsize=(16,8))
sns.set_style('whitegrid')
plt.subplot(1,2,1)
Data_Scientist = df[df['JOB_TITLE'] == "DATA SCIENTIST"].groupby('YEAR').count()['CASE_STATUS']
certified = df[df['CASE_STATUS'].isin(['CERTIFIED']) & df['JOB_TITLE'].isin(['DATA SCIENTIST'])].groupby('YEAR').count()['CASE_STATUS']
year = [ i for i in range(2011,2017)]
sns.lineplot(x = year,y = Data_Scientist,legend = 'brief',color='red', label='No of Applications')
sns.lineplot(x = year,y = certified.values,color='green', label = 'Certified')
plt.title("No of applications over years")
plt.plot();

plt.subplot(1,2,2)
plt.title("Salary Distribution")
sns.histplot(df[df['JOB_TITLE'] == "DATA SCIENTIST"]["PREVAILING_WAGE"],color='green')
plt.plot();
Data Engineer
plt.figure(figsize=(16,8))
plt.subplot(1,2,1)
Data_Scientist = df[df['JOB_TITLE'] == "DATA ENGINEER"].groupby('YEAR').count()['CASE_STATUS']
certified = df[df['CASE_STATUS'].isin(['CERTIFIED']) & df['JOB_TITLE'].isin(['DATA ENGINEER'])].groupby('YEAR').count()['CASE_STATUS']
year = [ i for i in range(2011,2017)]
sns.lineplot(x = year,y = Data_Scientist,color='red',label='No of Applications')
sns.lineplot(x = year,y = certified.values,color='green',label = 'Certified')
plt.title("No of applications over years")
plt.plot();

plt.subplot(1,2,2)
plt.title("Salary Distribution")
sns.histplot(df[df['JOB_TITLE'] == "DATA ENGINEER"]["PREVAILING_WAGE"],color='green')
plt.plot();
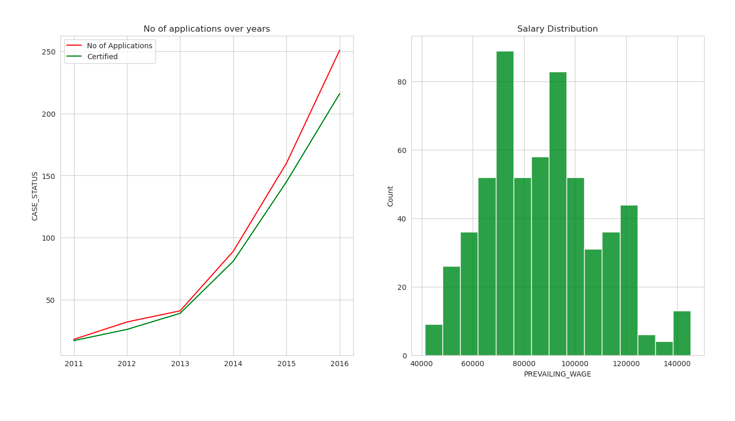
Data Analyst
plt.figure(figsize=(16,8))
plt.subplot(1,2,1)
Data_Scientist = df[df['JOB_TITLE'] == "DATA ANALYST"].groupby('YEAR').count()['CASE_STATUS']
certified = df[df['CASE_STATUS'].isin(['CERTIFIED']) & df['JOB_TITLE'].isin(['DATA ANALYST'])].groupby('YEAR').count()['CASE_STATUS']

year = [ i for i in range(2011,2017)]
sns.lineplot(x = year,y = Data_Scientist,color='red',label='No of Applications')
sns.lineplot(x = year,y = certified.values,color='green', label = 'Certified')
plt.title("No of applications over years")
plt.plot();

plt.subplot(1,2,2)
plt.title("Salary Distribution")
DA = df[(df['JOB_TITLE'] == "DATA ANALYST") & (df['PREVAILING_WAGE']<200000)]
sns.histplot(DA['PREVAILING_WAGE'],color='green')
plt.plot();
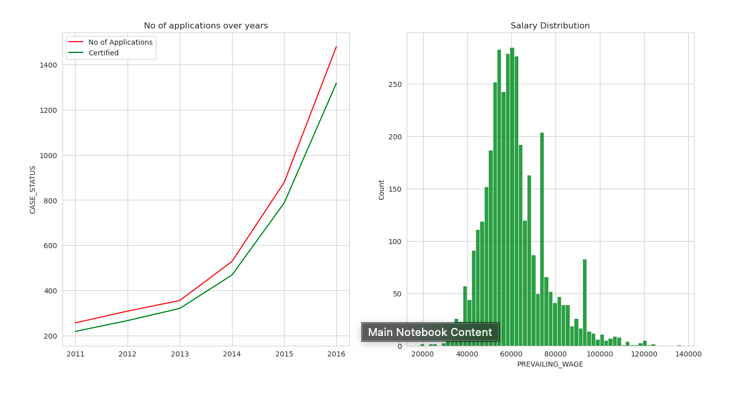 Findings:
- Red line signifies the no of applications and green signifies the no of applications got certified.
- Data roles are the most dominant roles in the 21st Century.
- Less skilled people and high wages are clearly evident from the above graphs.
- Getting a H1B is highly likely if you have a offer with Data Roles.
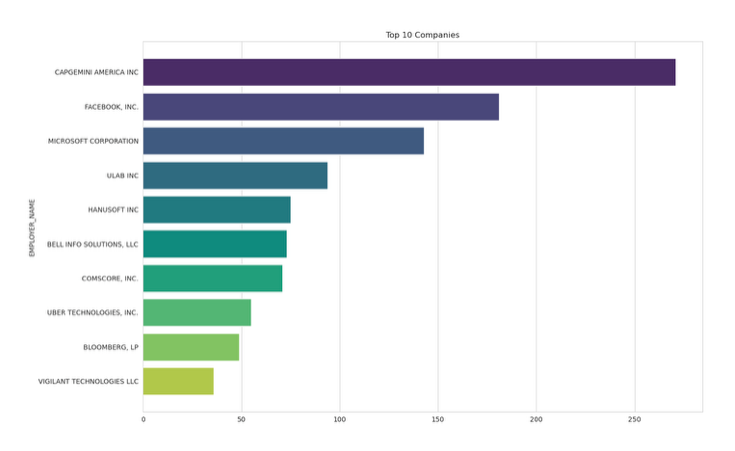
Companies offering H1B for Data related roles
plt.figure(figsize=(15,10))
companies = df[df['JOB_TITLE'].isin(['DATA ANALYST','DATA ENGINEER','DATA SCIENTIST'])].groupby('EMPLOYER_NAME').count().sort_values(by='CASE_STATUS',ascending=False)[:10]['CASE_STATUS']
sns.set_style('whitegrid')
sns.barplot(x = companies.values,y = companies.index,orient='h',palette='viridis')
plt.title("Top 10 Companies")
plt.plot();
Rejection & Acceptance Rate
df3 = df.groupby(['EMPLOYER_NAME','CASE_STATUS']).count().reset_index()
df3 = df3[df3['CASE_STATUS'].isin(['CERTIFIED'])][['EMPLOYER_NAME','JOB_TITLE']]
df4 = df.groupby('EMPLOYER_NAME',).count().reset_index()[['EMPLOYER_NAME','JOB_TITLE']]
df4.columns = ['EMPLOYER_NAME','TOTAL']
df5 = df4.join(df3.set_index('EMPLOYER_NAME'),on='EMPLOYER_NAME')
df5['%Certified'] = round(df5['JOB_TITLE']/df5['TOTAL']*100,2)
df5.columns = ['EMPLOYER','TOTAL_APPLICATIONS','Approved','%']
df5 = df5[df5['TOTAL_APPLICATIONS']>1000]
def chipchop(x):
    if x == 'ADVENT GLOBAL SOLUTIONS INC.':
        return 'ADVENT GLOBAL'
    elif x == 'INDIANA UNIV. PURDUE UNIV. INDIANAPOLIS':
        return 'INDIANA UNIV'
    elif x == 'AMERICAN INFORMATION TECHNOLOGY CORPORATION':
        return 'US INFOTECH CORP'
    elif x == 'EXILANT TECHNOLOGIES PRIVATE LIMITED':
        return 'EXILANT TECH'
    else:
        return x
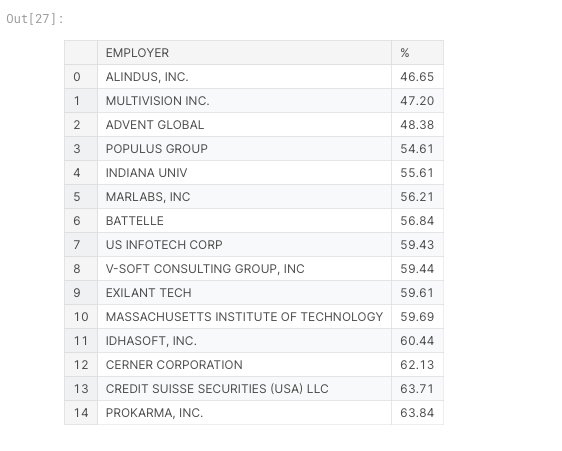
Top 15 Companies with lowest Certified %
low_prop = df5.sort_values(by='%')
low_prop['EMPLOYER'] = low_prop['EMPLOYER'].apply(chipchop)
low_prop[['EMPLOYER','%']][:15].reset_index().drop('index',axis=1)
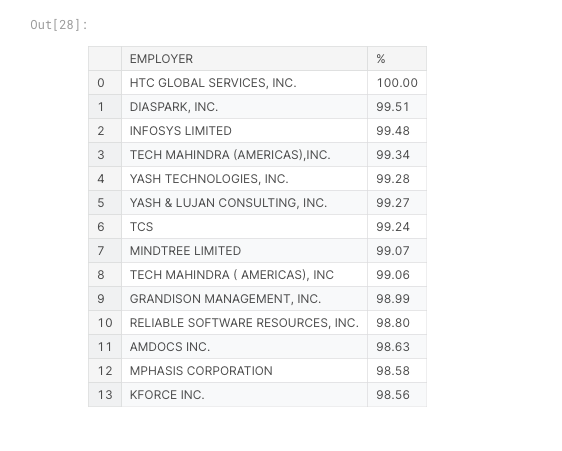
Top 15 Companies with highest Certified %
low_prop = df5.sort_values(by='%',ascending=False)
low_prop['EMPLOYER'] = low_prop['EMPLOYER'].apply(chipchop)
low_prop[['EMPLOYER','%']][1:15].reset_index().drop('index',axis=1)
Applications all over United States
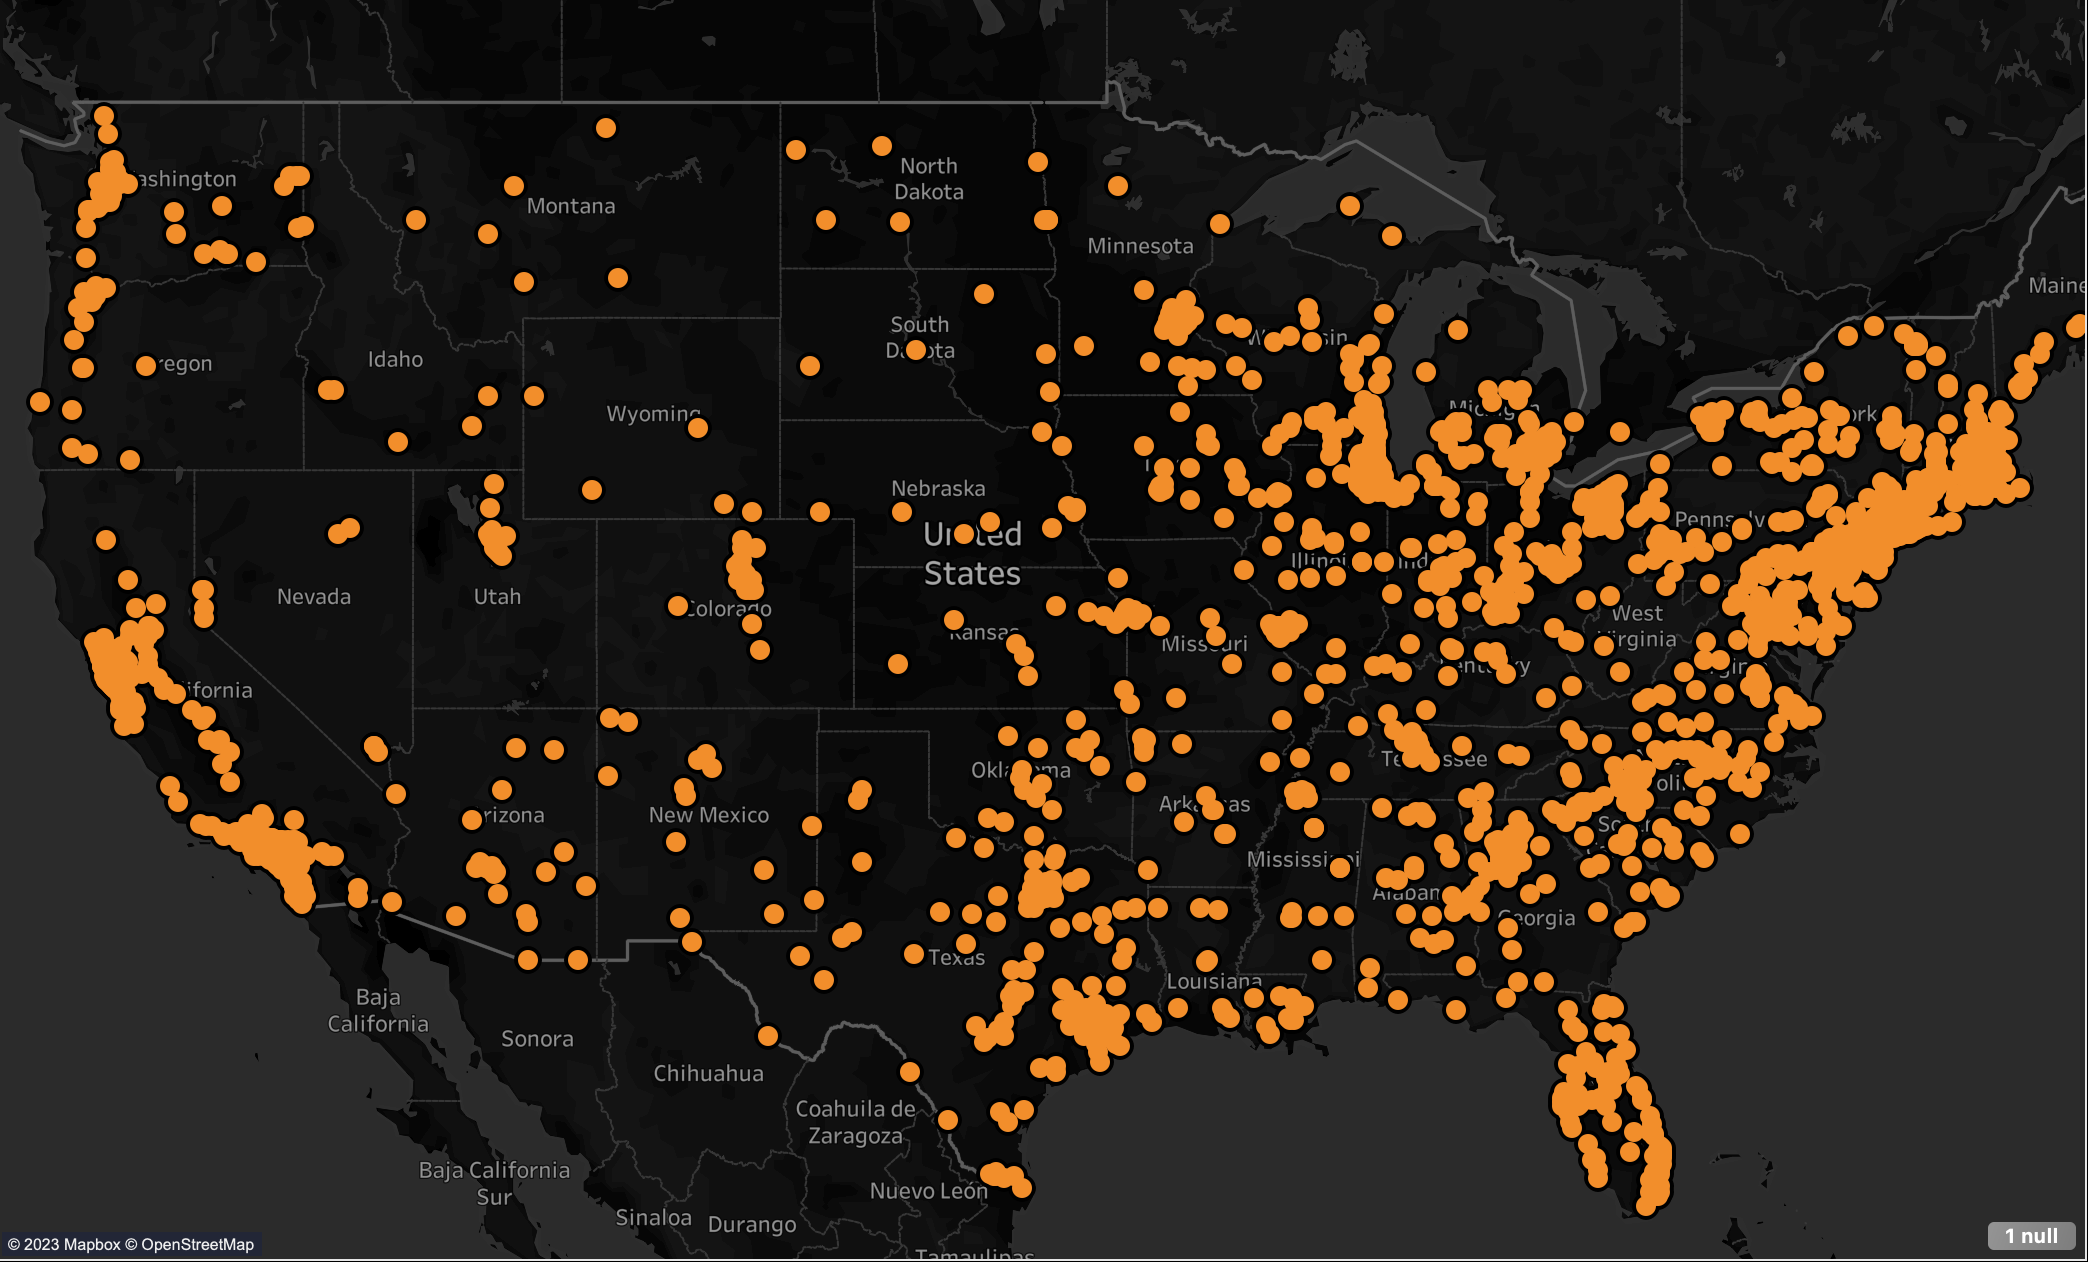
Findings:
- Most of the applications are concentrated on the northern part of United states. Which is the home for major companies.
- Second high dense cluster is found on the south part of the United States. i.e California.. etc.
Conclusion
- No of applications are growing rapidly so a the no of applications being approved.
- Infosys, TCS, Wipro offers the highest no of H1B applications as compared to other companies.
- Some of the key roles attracting H1B are related to software developer, Analyst, Testing.
- Even though the number of applications are higher for software related roles, The Data related roles seems to be yielding great returns.
- Data related roles has very low rejection rate and high paying salaries.
- Some of the Companies had as low as 45% Acceptance rate.
- Most of the applications over the year are concentrated over the Northern and Southern part of the Country.